Find the information you need
Enter some keywords, topic or resources you are looking for:
Welcome to Beebase
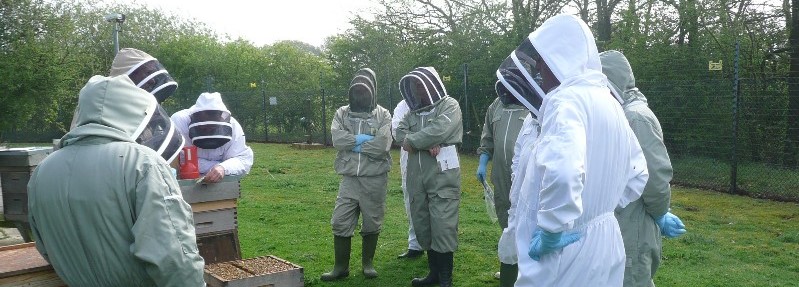
BeeBase is the Animal and Plant Health Agency's (APHA) National Bee Unit website. It is designed for beekeepers and supports Defra, Welsh Government and Scotland's Bee Health Programmes. BeeBase supports the aims of the Healthy Bees Plan 2030, which focuses on protecting and sustaining our valuable national bee stocks.
Our website provides a wide range of apicultural information for beekeepers, to help keep their colonies healthy and productive. It provides a wide range of beekeeping information, such as the activities of the NBU, honey bee related legislation, pests and diseases information which includes their recognition and control, publications, advisory leaflets and key contacts.
Please play your part and help us by signing up to BeeBase here.
We hope both new and experienced beekeepers will find this an extremely useful resource and sign up.
Knowing the distribution of beekeepers and their apiaries across the country helps us to effectively monitor and control the spread of serious honey bee pests and diseases, as well as provide up-to-date information in keeping bees healthy and productive. By telling us who you are you'll be playing a very important part in helping to maintain and sustain honey bees for the future. Joining a Beekeeping Association has many advantages for both new beekeepers and the more experienced. You can also look at our Contacts page for more information.
Please use this link provide email feedback on what you think and what you'd like to see on the site. If you've got any question, why not start with our FAQ page?
Our latest news stories are shown in the section on the right, for other news please go to the About Us section.
Latest News
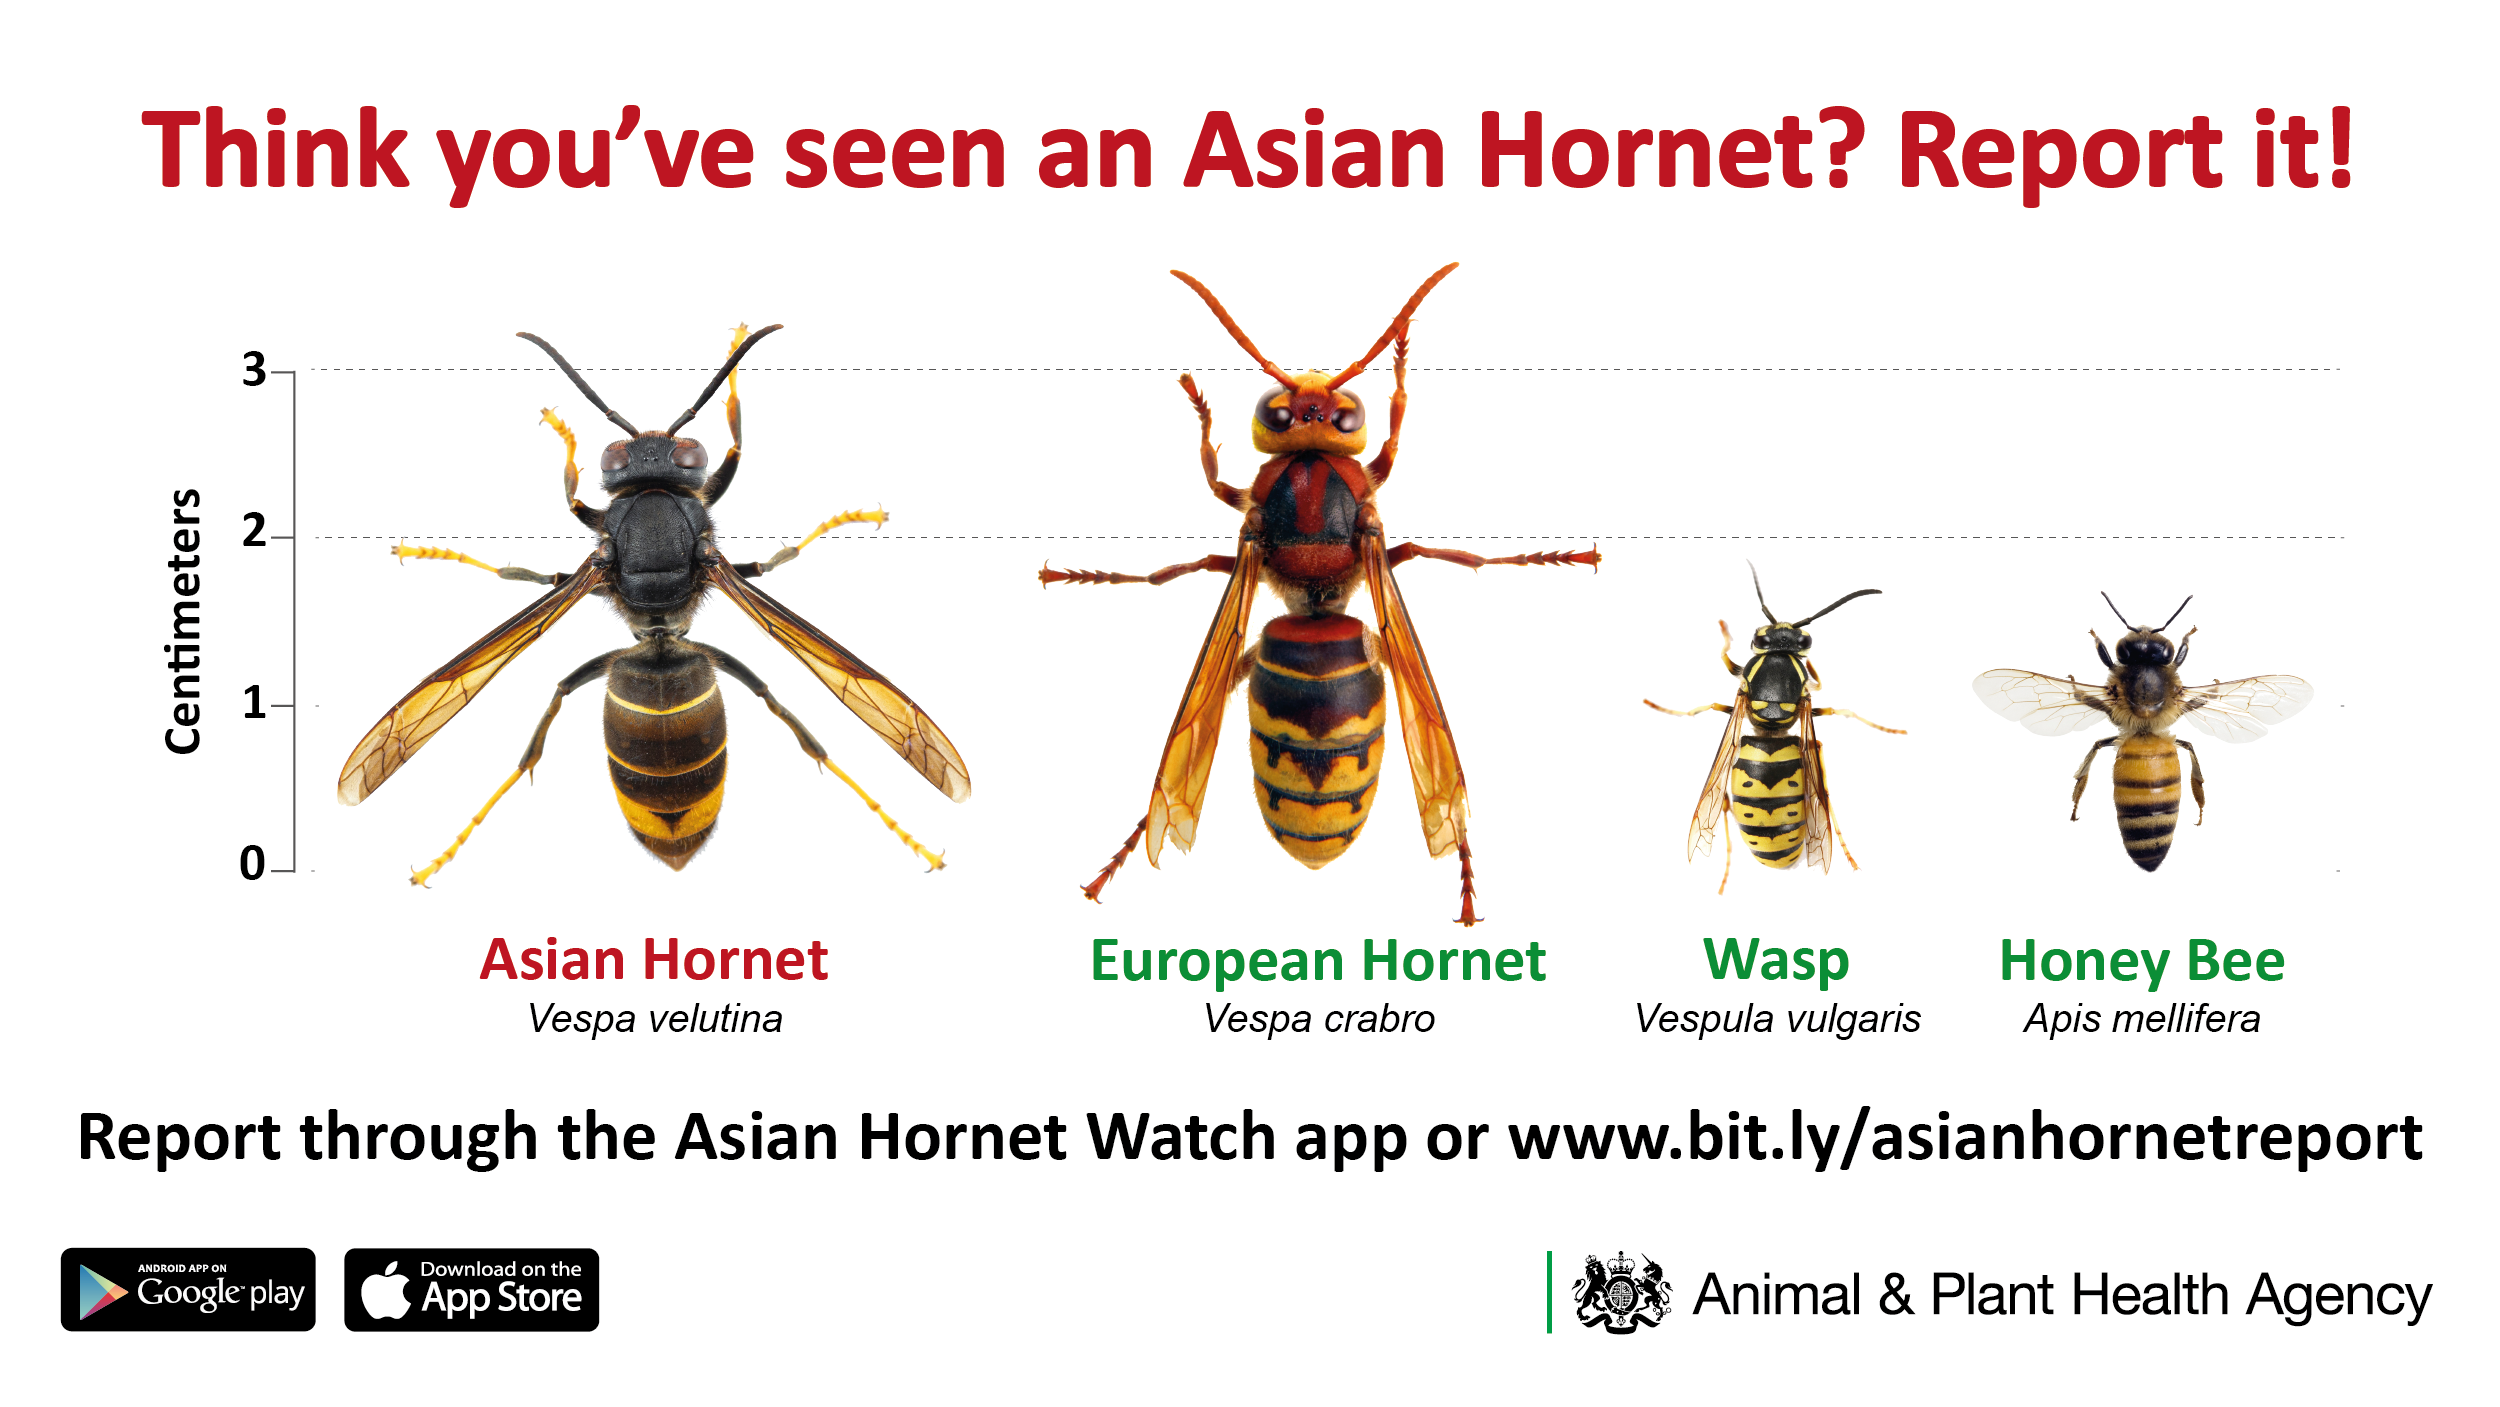
Asian Hornet - April Update
At the beginning of April, the NBU began spring trapping in areas identified as high risk.
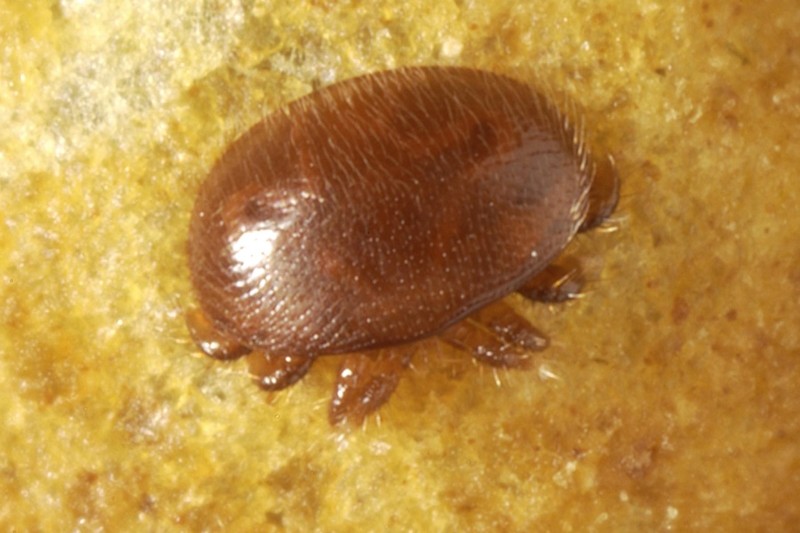
Varroa advisory leaflet update
Our 'Managing Varroa' advisory leaflet has been updated.